Advanced Component Features
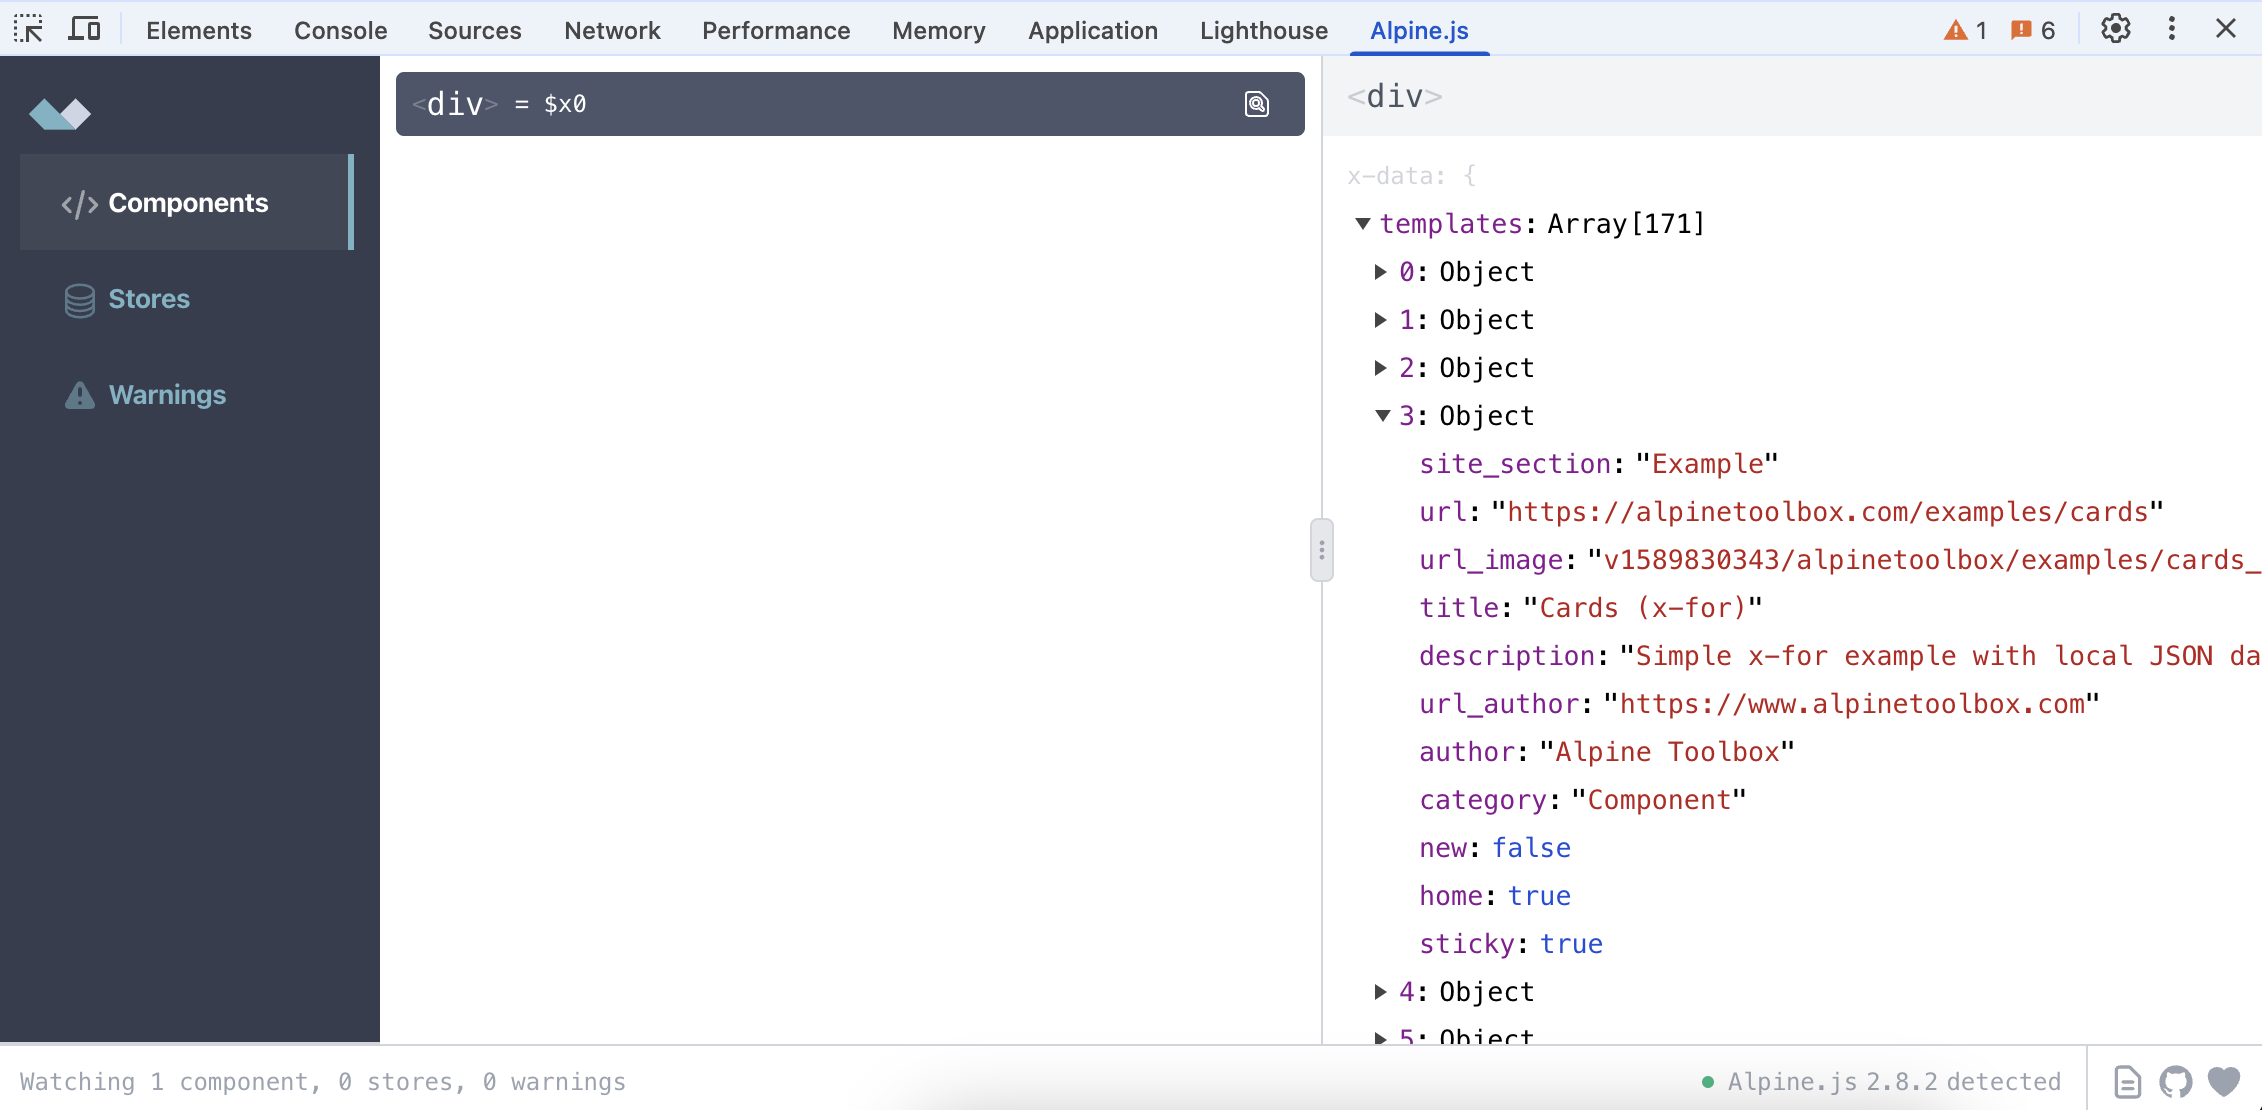
Jump to Element
Stop hunting through the DOM. Instantly jump from the devtools to the root element of any Alpine.js component in your browser's Elements inspector. This makes it incredibly fast to find and debug your components.
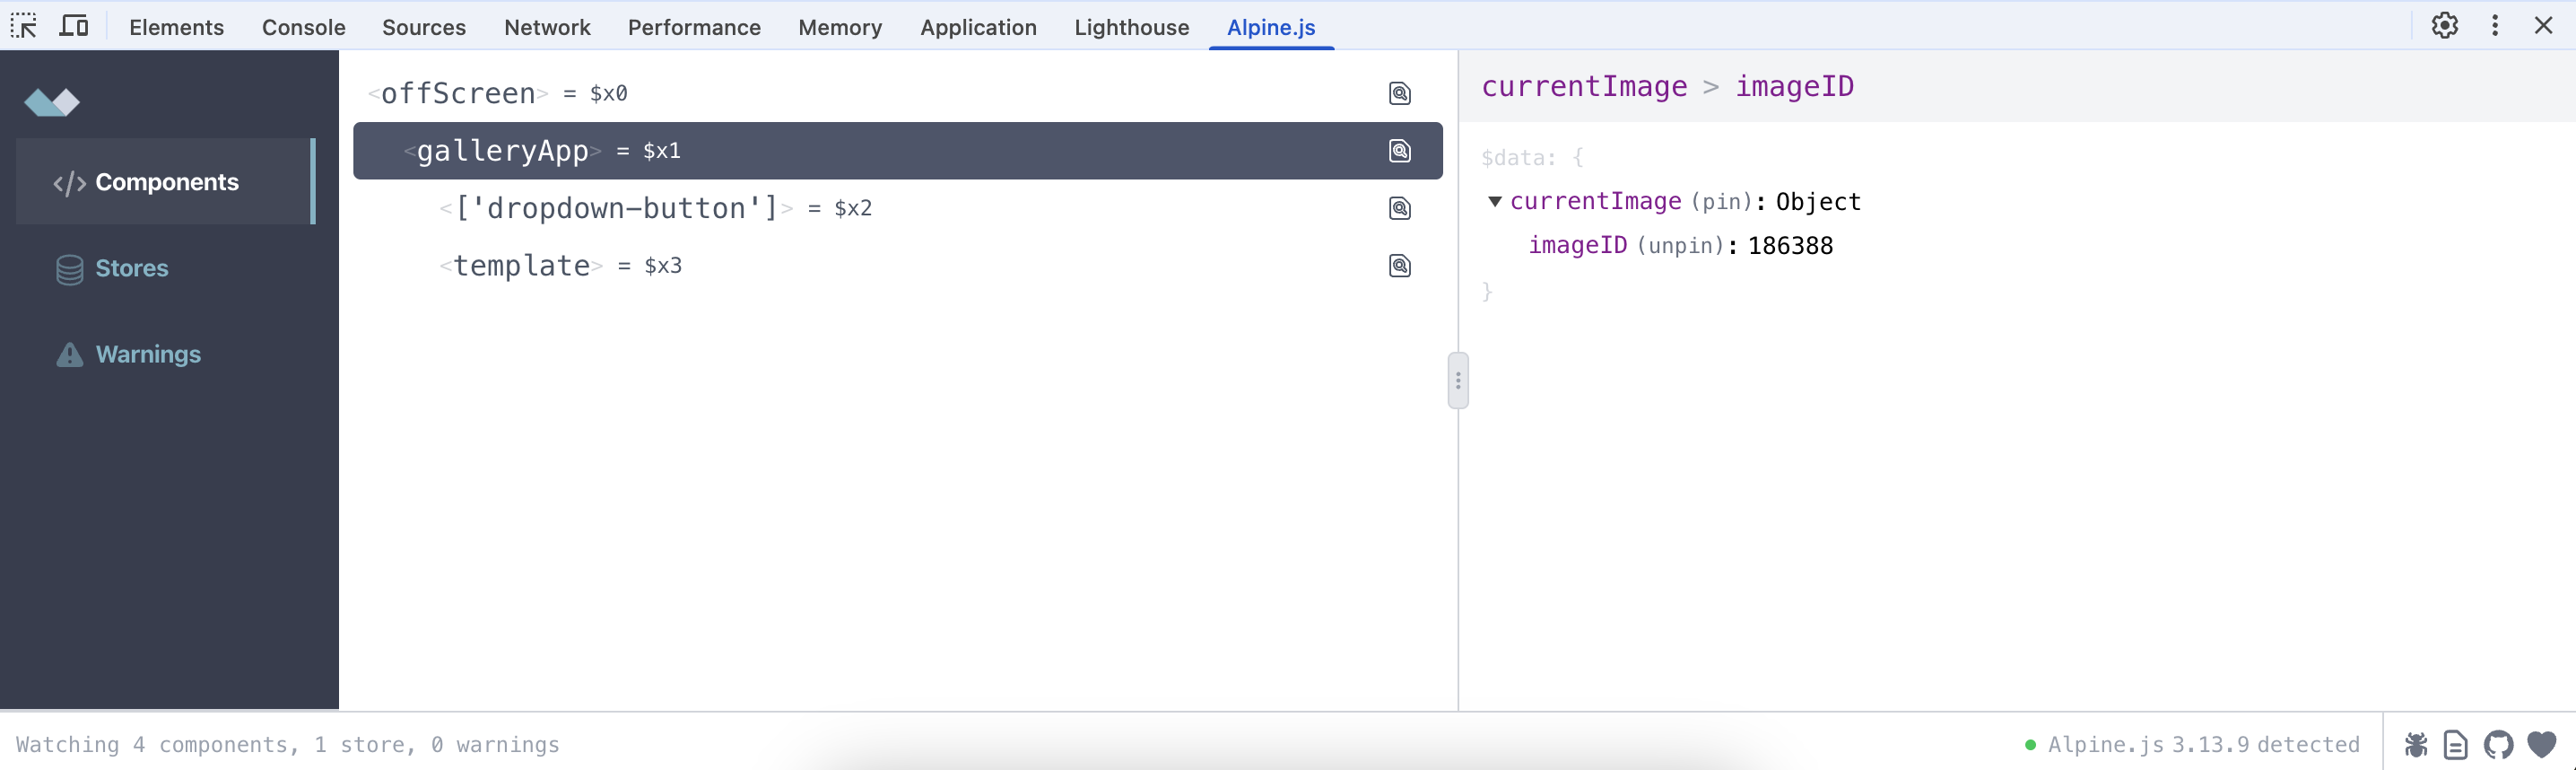
Pin Value
Focus on the data that matters. The "pin" feature lets you isolate and monitor specific data attributes within your components, even in large and complex data sets. Keep important values always in sight.
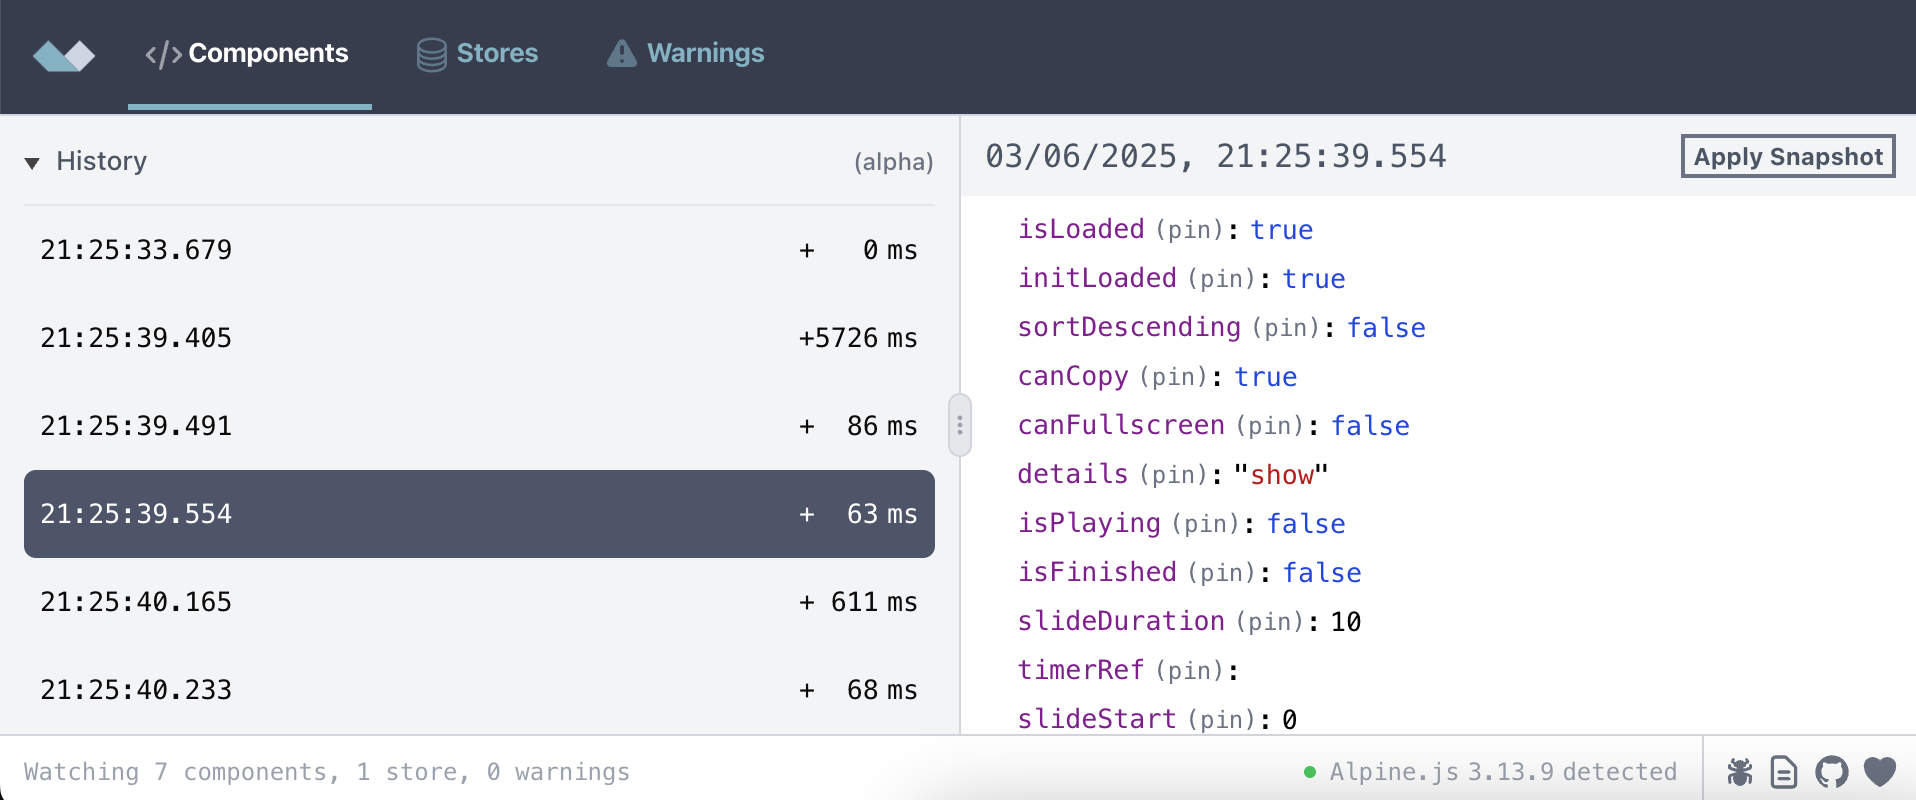
Time Travel Debugging
Effortlessly debug component state changes. The history tab tracks every data mutation, allowing you to inspect previous states and even "time travel" back to a specific snapshot to understand how your component's data has changed over time.
Highlight Component on Page
Quickly locate your components on the page. When you hover over a component in the devtools, it will be highlighted with a blue overlay on the web page, making it easy to see which element you are inspecting.
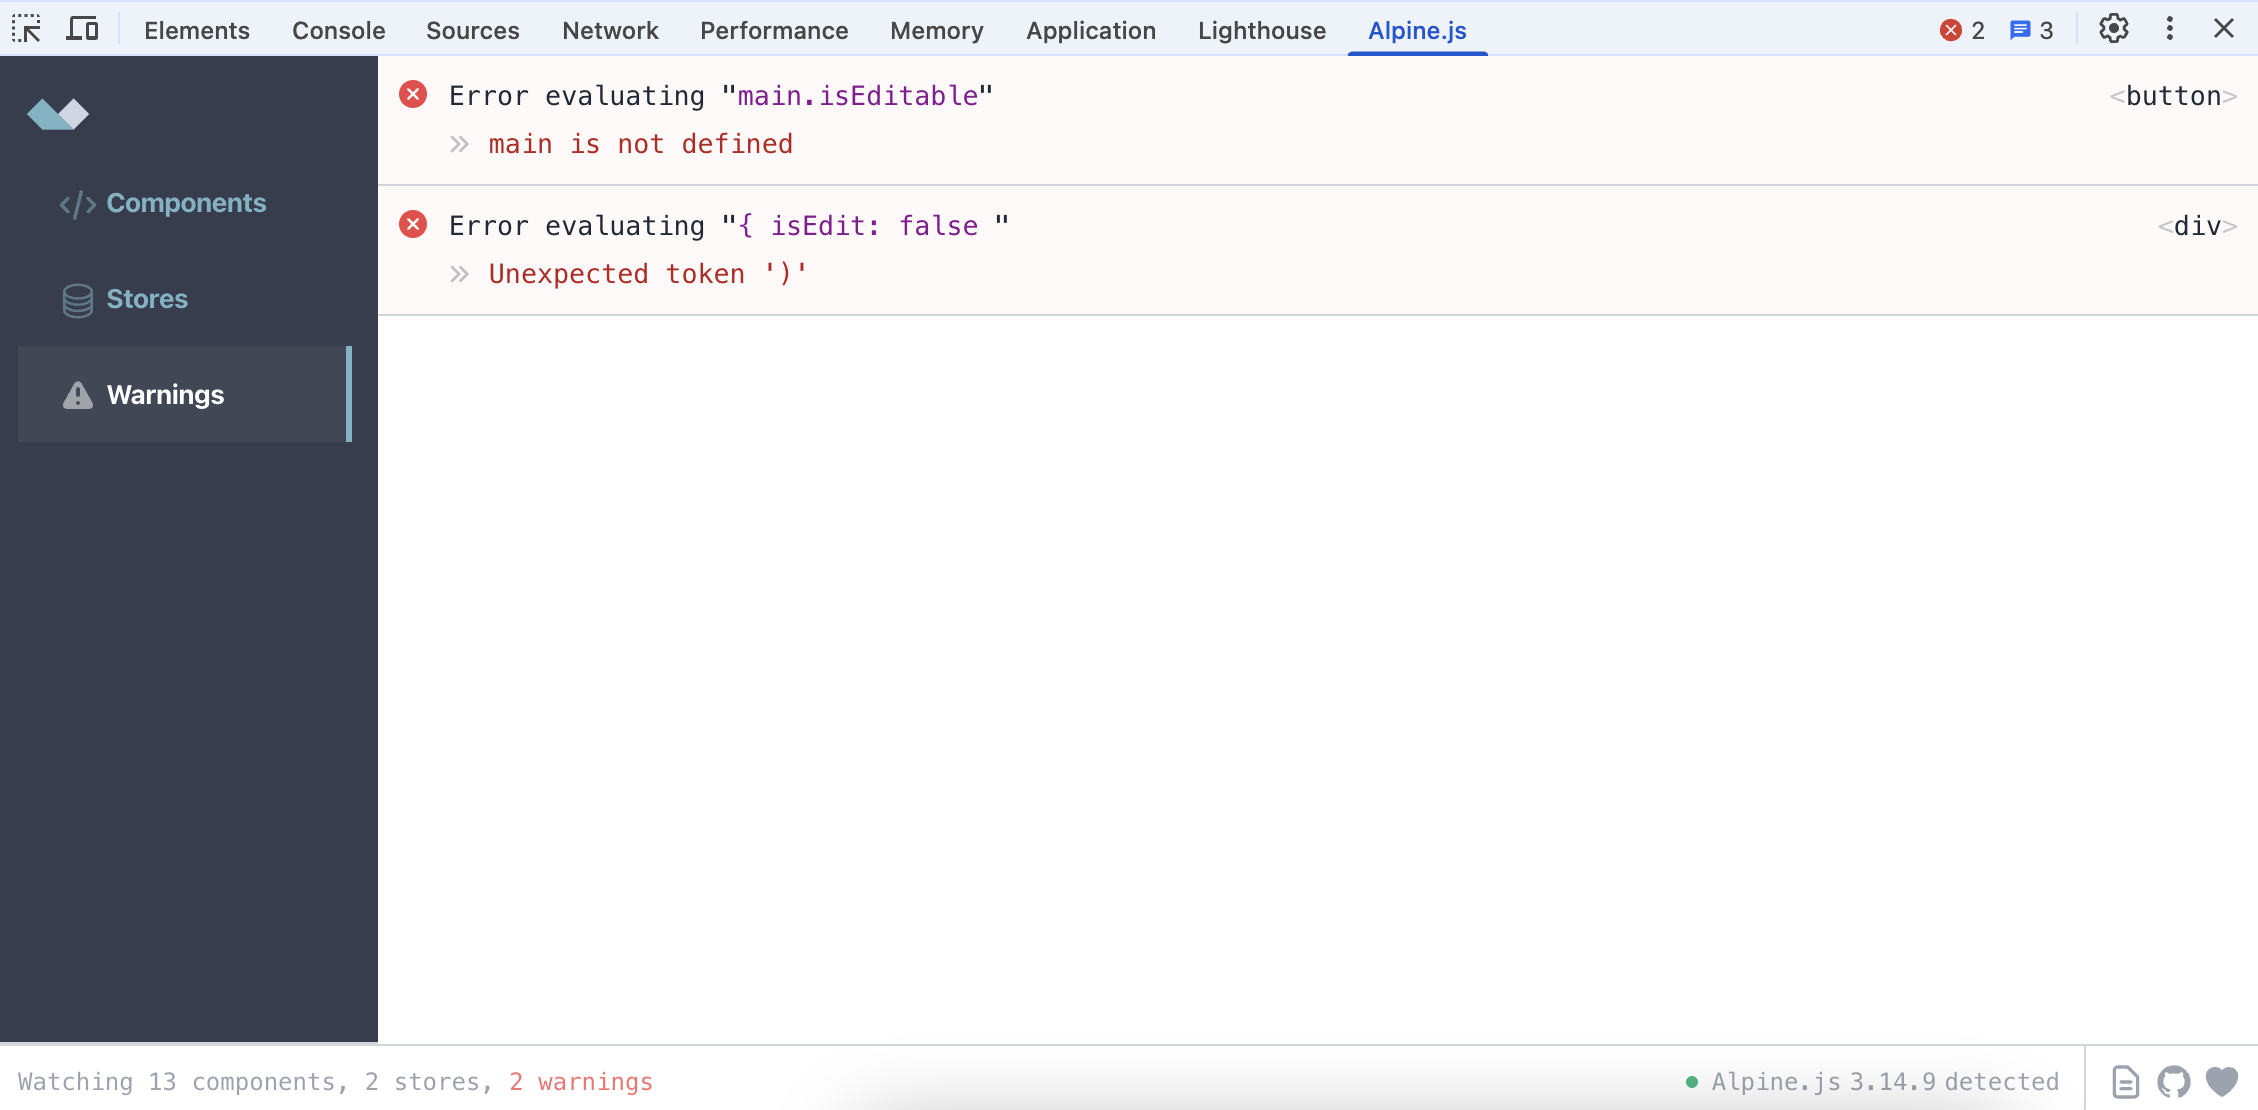
Component-Specific Error Warnings
Debug errors faster with the "Warnings" tab. It displays formatted evaluation errors from Alpine.js expressions and allows you to jump directly to the component element that caused the error, saving you valuable debugging time.
Scroll Component Into View
Lost a component on a long page? With a single click, you can scroll the component's root element into the viewport, so you never lose track of the elements you're debugging.

Built by Hugo Di Francesco
Lead Software Engineer, top committer to alpinejs-devtools since 2020, top answerer for Alpine.js questions and 4-time technical book author.
